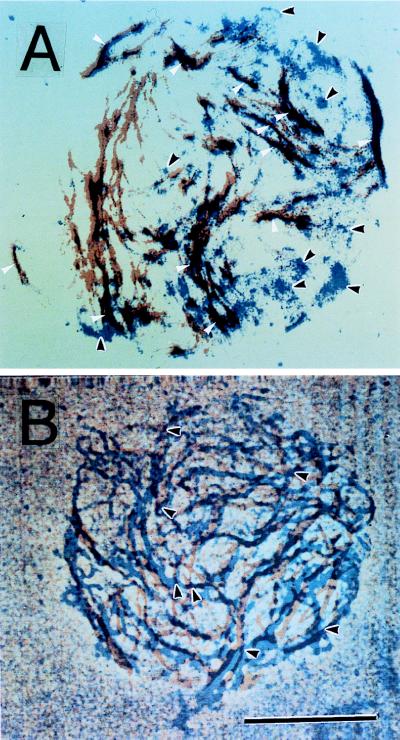
Figure 4.
Superimposition of images of β-glucan microfibrils and cortical microtubules. (A) Deposition difference between microfibrils and microtubules. White arrows indicate the congruence of microfibrils and microtubules, and black arrows indicate cellulose microfibrils or masses deposited independent from the microtubules. (B) Crossing of microfibrils over microtubules. Black arrows indicate a microfibril crossing over a microtubule. Microfibrils are shown in blue and microtubules in red, and both colors were combined in the combined regions (purple). (Magnification bar is 5 μm.)

