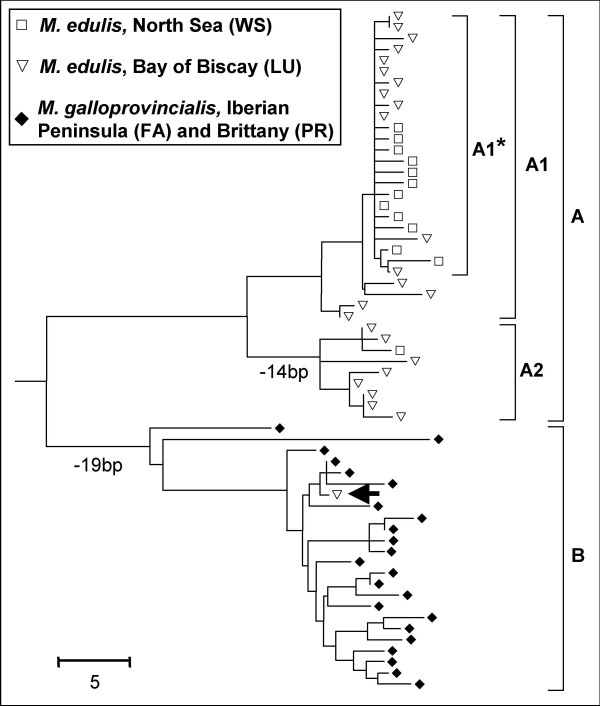
Figure 4.
Neighbor Joining tree on the number of nucleotide differences at the EFseq locus. Sequences sampled in M. edulis populations of the North Sea and the Bay of Biscay are represented by white squares and white triangles respectively. Sequences sampled in M. galloprovincialis populations of the Atlantic coast of the Iberian Peninsula and Brittany are represented by black diamonds. The tree is rooted by using three sequences from a population of M. trossulus of the Baltic Sea (Gdansk, Poland) that are not represented for clarity. Branches in which biggest deletions that explain major changes in the size of EFbis alleles are indicated by the reduction in length in base pair (bp). The single sequence of the clade B sampled in an M. edulis population is indicated by an arrow.

