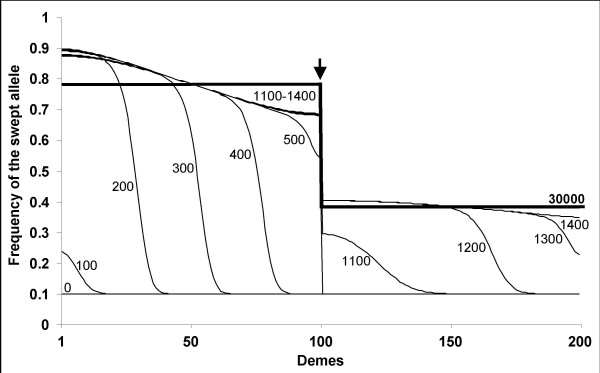
Figure 8.
Genetic hitchhiking past a barrier to gene flow. Frequency of the neutral allele A initially linked to the favorable allele. Generations during which allele frequencies were recorded are indicated next to the curves. Results from a linear one-dimensional stepping-stone model with p0 = 0.0001, m = 0.3, s = 0.1, c = 0.01 and mbar = 10-8. Two hundred demes were used with a barrier to the right of deme 100. The position of the barrier is indicated by a vertical arrow. Note the steplike discontinuity in clines at the barrier where all curves are vertical.

