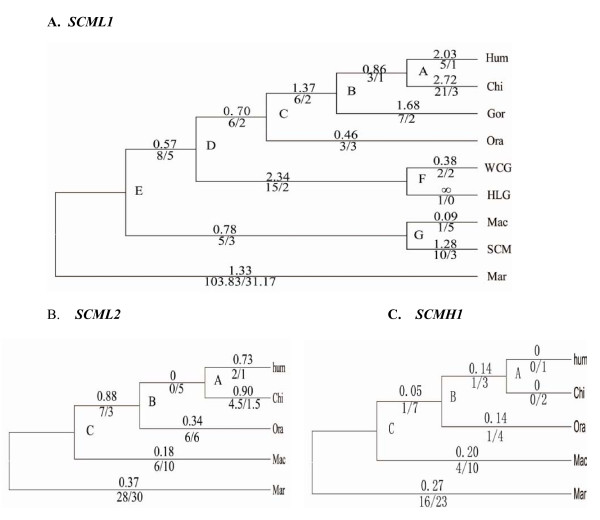
Figure 2.
Molecular evolution of SCML1, SCML2 and SCMH reconstructed over the known phylogenetic tree of primates. A) The ω values of different lineages in primates were calculated using the SCML1 coding sequences. The phylogeny was drawn roughly to the scale of evolutionary time. ∞ refers to ω value with dS being zero. B, C) The phylogenetic trees of SCML2 and SCMH1. The ω values are shown above each branch. The numbers of nonsynonymous vs. synonymous substitutions (N/S) are shown below each branch.

