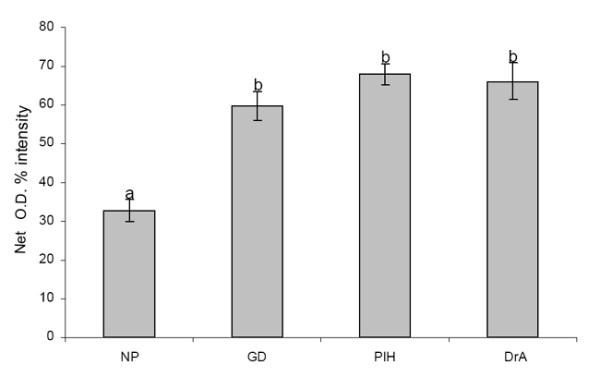
Figure 4.

Quantitative evaluation of TRO-tf-01 immunoreactivity in placental samples. Each column represents mean (± SE) from fifteen net optical densities (Net O.D.) measured in three different placentae. NP, normal pregnancies; GD, gestational diabetes during pregnancy; PIH, pregnancy-induced hypertension during pregnancy; DrA, drug-abusing mothers during pregnancy. Statistical analysis has shown highly significant differences (p < 0.001) between normal (a) and each of the selected abnormal pregnancy types (b).
