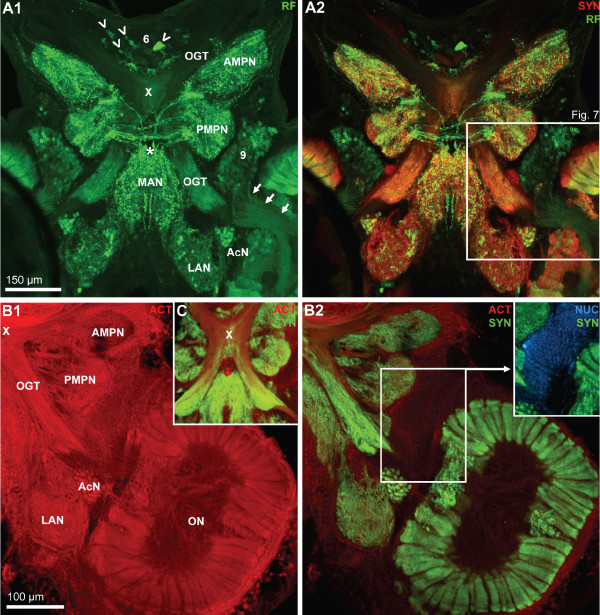
Figure 7.
A1, A2: A horizontal section double labeled for synapsin immunoreactivity (SYN; red) and RFamide-like immunoreactivity (RF; green) to show the course of the olfactory globular tract (OGT); confocal laser scan microscopy. The X labels the chiasm of the olfactory globular tract. Arrowheads identify peptidergic somata in the anteriorly located cell cluster (6). Arrows point towards a bundle of neurites from cluster (9) olfactory interneurons that penetrate into the olfactory lobe. The cerebral artery is labeled with an asterisk. The boxed area in A2 is shown in a higher magnification in Fig. 2. B1, B2, C: Triple labeled section showing actin histochemistry (ACT; red), Synapsin immunoreactivity (SYN; green), and localization of nuclei (NUC; blue) to show the course of the olfactory globular tract (OGT); conventional fluorescence combined with the Apotome structured illumination technique for optical sectioning. The X labels the chiasm of the olfactory globular tract. A2 shows the red channel only, and B2 and C the red and green channel. The inset in B2 shows the green and the blue channel. Abbreviations: 6 cell cluster (6), AcN accessory lobe/neuropil, AMPN anterior medial protocerebral neuropil, LAN lateral antenna 1 neuropil, MAN median antenna 1 neuropil, OGT olfactory globular tract, ON olfactory lobe/neuropil, PMPN posterior medial protocerebral neuropil.

