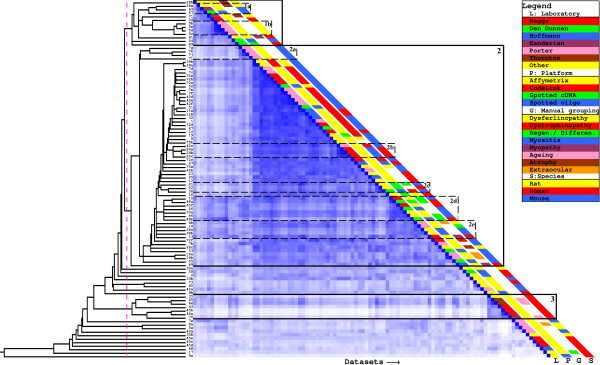
Figure 4.
LAMA-based hierarchical clustering and heatmap. The dotted pink line indicates the used clustering cutoff and identified clusters are indicated in addition to relevat subclusters. The dataset ids are shown between the tree and the heatmap. The colored bars provide background information on the datasets.

