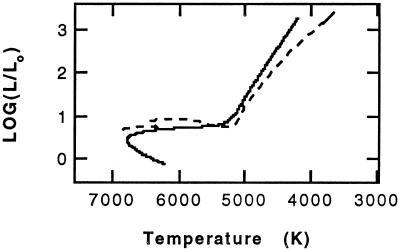
Figure 1.
Evolutionary tracks are shown for models that cross the temperature region of the lithium dip. While on the main sequence, Pop I models (1.50 M⊙ X = 0.70, z = 0.02) decrease in temperature. The Pop II (0.8 M⊙ X = 0.76, Z = 0.0002) model increases significantly in temperature and luminosity over its main-sequence lifetime, then decreases as a subgiant.

