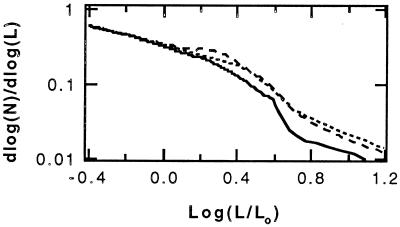
Figure 7.
The calculated luminosity function of a mass-conserving cluster at an age of 15 Gyr is shown as a solid line. Luminosity functions predicted for models losing 0.03 M⊙ (dotted line) and 0.05 M⊙ (dashed line) are shown for ages that have the same turnoff luminosity. Mass loss in a narrow-temperature region enhances the number of stars at the lower edge of that temperature range, resulting in a bump on the luminosity function.

