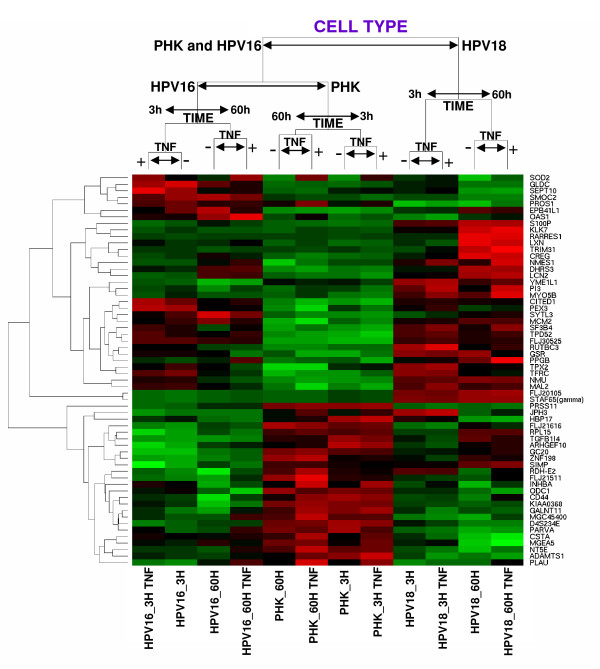
Figure 2.
Hierarchical grouping based on differentially expressed genes as a function of cell type. These genes where identified by the ANOVA method and the samples where grouped considering the correlation distance and complete linkage. After sample grouping the genes (p values <10-10) were hierarchically grouped by their correlation distances. High gene expression is shown in red, low gene expression is shown in green and black indicates non-differential gene expression. Samples: Primary human keratinocytes: controls and treated for 3 or 60 hours with TNF, respectively (PHK_3H, PHK_60H, PHK_3H.TNF, PHK_60H.TNF); HPV16-immortalized keratinocytes: controls and treated for 3 or 60 hours with TNF, respectively (HPV16_3H, HPV16_60H, HPV16_3H.TNF, HPV16_60H.TNF); HPV18-immortalized keratinocytes: controls and treated with 3 or 60 hours for TNF, respectively (HPV18_3H, HPV18_60H, HPV18_3H.TNF, HPV18_60H.TNF).

