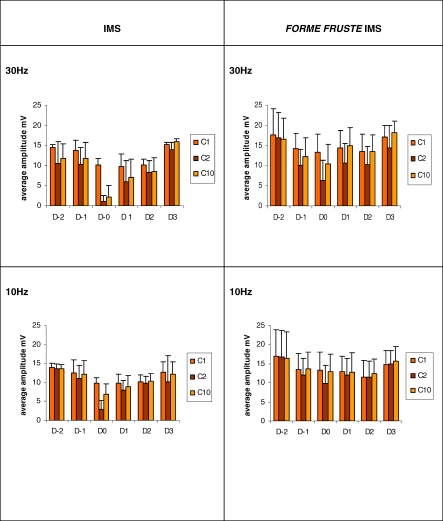
Figure 5. Comparison of Average Amplitudes of C1, C2, and C10 between IMS and forme fruste Groups.
The average amplitude of C1 (first CMAP), C2 (second CMAP), and C10 (tenth CMAP) in the Clinical IMS and forme fruste IMS at 10Hz and 30Hz frequency. Changes are plotted for each day relative to day 0 (D0). D0 in the clinical IMS group is the day they were diagnosed as clinical IMS. The D0 in forme fruste group is the day they were detected to have maximal muscle weakness.

