
Figure 1.
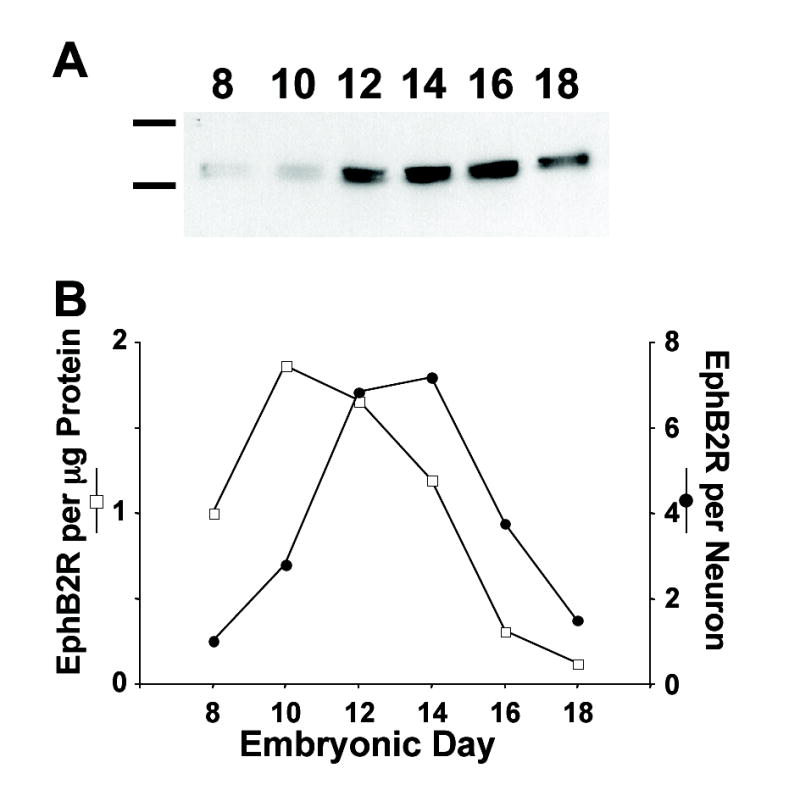
Developmental timecourse for EphB2R appearance in chick ciliary ganglia. (A) Western blots of embryonic ciliary ganglia dissected at the indicated times, solubilized, electrophoresed, and probed with anti-EphB2R Ab. Size standards (left): 116 (βgalactosidase) and 200 (myosin) kD. (B) Quantification of the Western blots, normalizing for the amount of ganglionic protein (open squares) or for the number of neurons present at each age (filled circles). Peak levels of EphB2R occur at E12–E14 and subsequently decline.