
Figure 2.
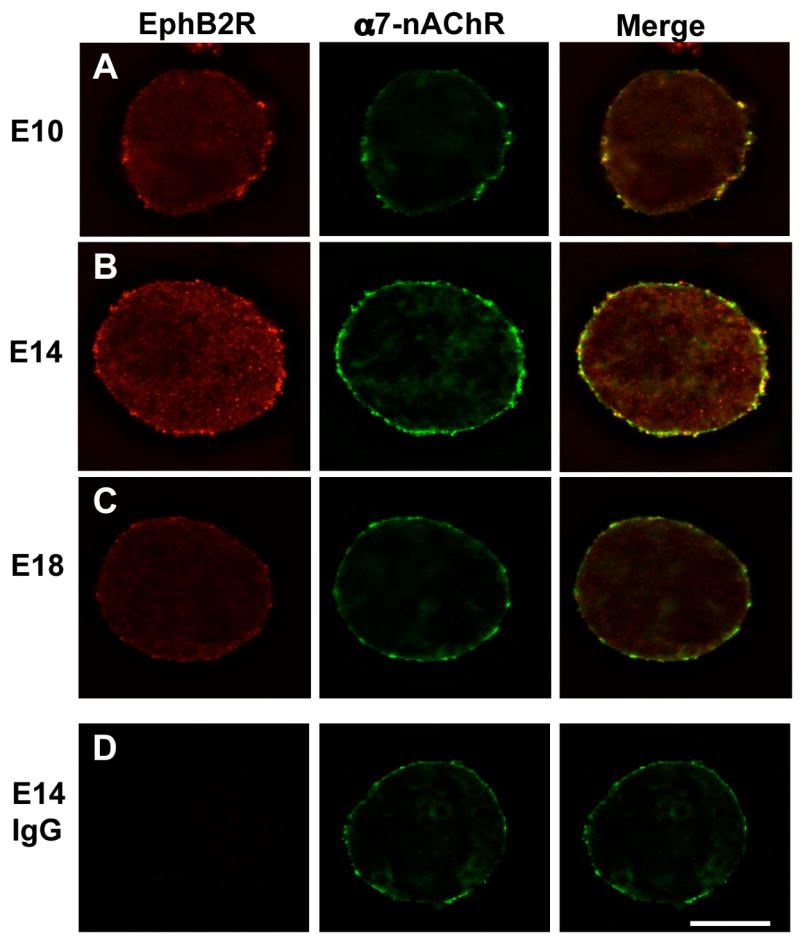
Surface distribution of EphB2R on CG neurons. Embryonic ganglia of the indicated ages were dissociated and co-stained for EphB2Rs (left; red) and α7-nAChRs (middle; green) , and the images overlaid (right; yellow). (A) E10. (B) E14. (C) E18. (D) E14 with non-immune IgG substituted for the anti-EphB2R Ab as a negative control. Scale bar: 10 μm. EphB2Rs co-distribute with α7-nAChRs on the neuron surface, and are most prominent at E14.