
Figure 4.
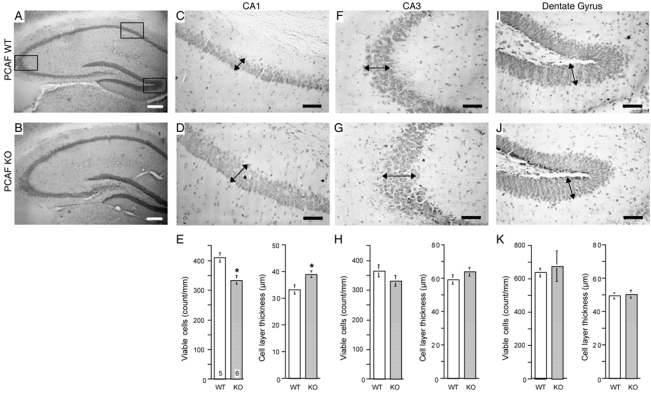
Morphological examination of the hippocampal formation of PCAF KO mice. Typical photomicrographs of the whole hippocampus (A, B), CA1 pyramidal neuronal layer (C, D), CA3 layer (F, G) and the dentate gyrus (I, J) of WT (A, C, F, I) and PCAF KO (B, D, G, J) mice. E, H, K, Quantification of the layer thickness in the three hippocampal areas. Squares in A show the localization of CA1, CA3 and the dentate gyrus. Arrows in C—J point out where the thickness was measured using NIH software. Quantification was based on the mean value for 3–6 slices per animal and the number of animals indicated within columns in (E). Scale bar = 100 μm in A, B; 50 μm in C—J. * p < 0.05 vs. the WT value (Student’s t-test).