
Figure 8.
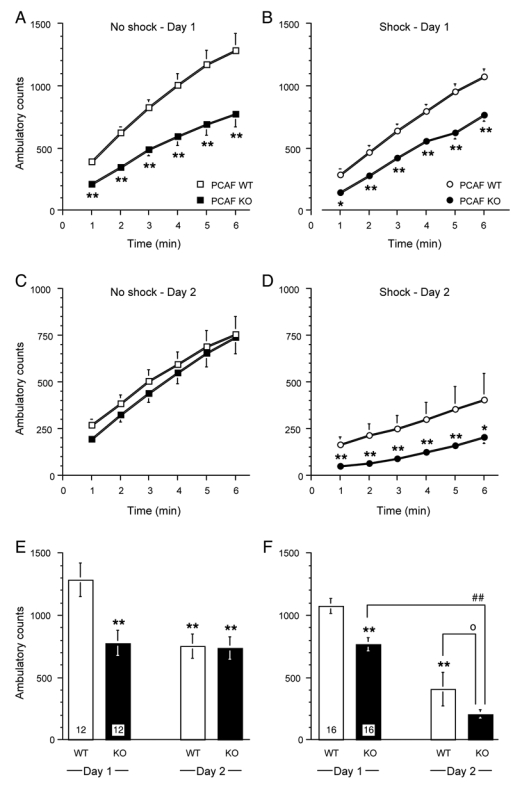
Increased freezing response in PCAF KO mice in the conditioned fear stress test. Responses of 2 month old WT and PCAF KO mice in the conditioned fear stress test: Time-course of ambulatory activity during the first 6 min of the session on day 1 for non-shocked control animals in (A) and shocked animals in (B). Time-course of the ambulatory activity during 6 min of the session on day 2 for non-shocked control animals in (C) and shocked animals in (D). Global activity score over 6 min for non-shocked control animals in E and shocked animals in F. The number of animals per group is indicated within columns in (E, F). In (A—D), data were analyzed using a two-way ANOVA with substrain and time as independent factors. * p < 0.05, ** p < 0.01 vs. WT value for the same time. In (E, F), data were analyzed using a two-way ANOVA with substrain and day as independent factors. ** p < 0.01 vs. WT value on day 1, ## p < 0.05 vs. day 1 value, o p < 0.05 vs. WT value on the same day (Newman-Keuls’ test).