
Figure 3. Examination of membrane permeability and DNA content following BHV-1 infection.
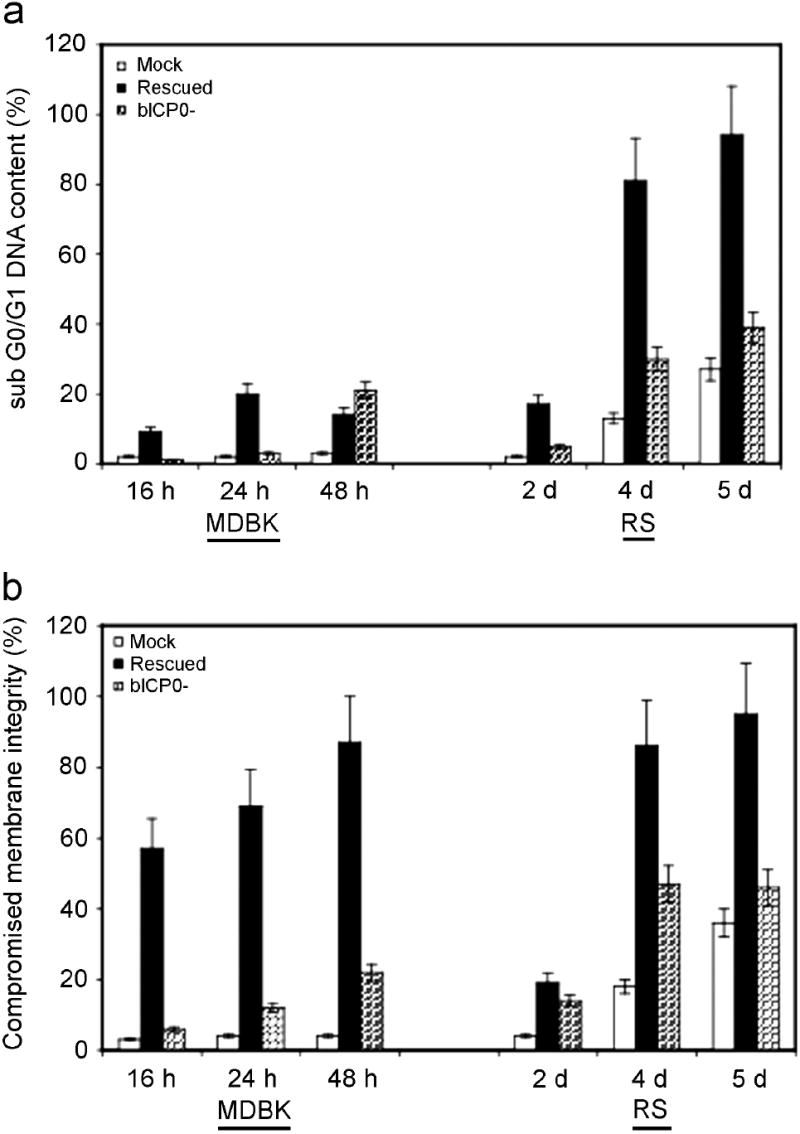
MDBK or RS cells were mock infected (M), or infected with the bICP0 null mutant (N) or the bICP0-rescued virus. A MOI = 1 was used for all viruses. At various times following infection, cells were collected, stained, and approximately 2 × 10⁴ viable cell events were analyzed by flow cytometry as described in materials and methods. The data presented are the average and standard deviation of two experiments and summarize the percent of the total cells that stained for altered membrane integrity. The data sets for RS cells at 2 and 5 dpi represent a single experiment. A Tukey-Kramer multiple comparisons post-ANOVA test demonstrated that the differences between MDBK cells infected with the bICP0 null mutant at 16 h after infection, and bICP0-rescued virus infected cells at 24 and 48 h after infection were significantly different compared to mock infected cells at the same time points (P < 0.01, 0.02, and 0.001, respectively). Although bICP0-rescued virus infected MDBK cells at 16 h after infection appeared to have a higher percentage of cells with compromised membrane integrity compared to mock infected cells, there was not a significant difference (P > 0.05). Rabbit skin cells infected with the bICP0 null mutant and the bICP0-rescued virus at 4 dpi were significantly different compared to mock infected cells on the same day (P < 0.01, and 0.002, respectively). Panel A: Determination of DNA content. Panel B: Determination of membrane permeability.