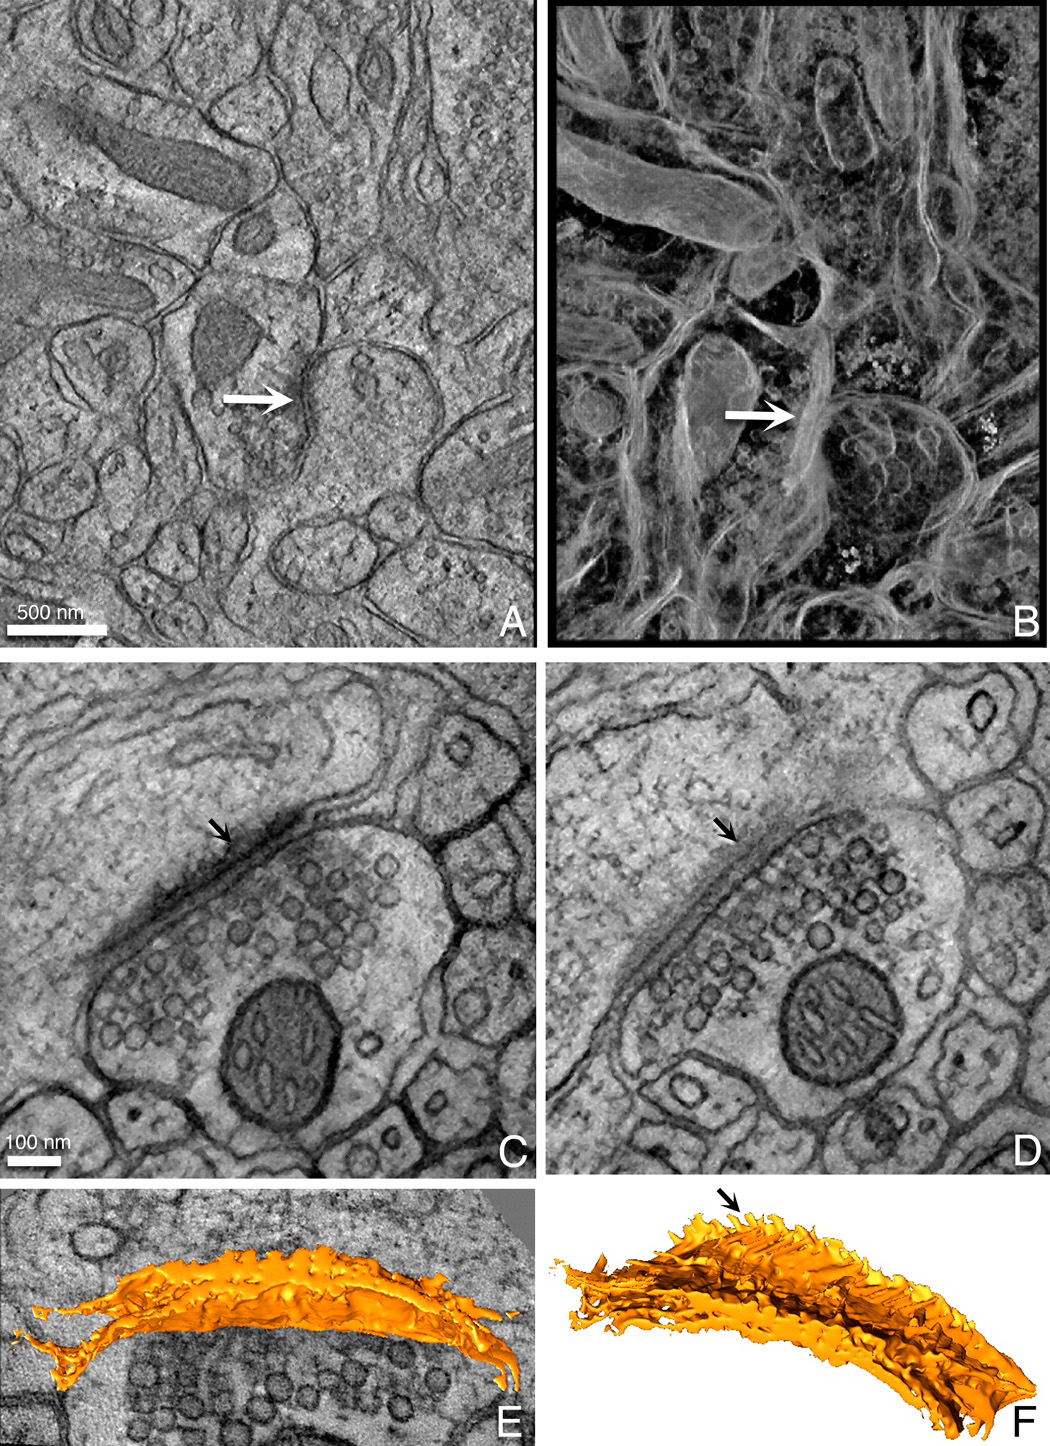
Figure 4. Tomograms of CAF-HPF cerebellar tissue.

Examples of a slice (A) and a volume rendering (B) of a 0.5 µm volume of cerebellum. The yellow arrow points to a postsynaptic density (PSD) surrounded by synaptic vesicles. Slices from a higher magnification tomogram of a well-preserved PSD are shown in (C) and (D). Arrows point to the fuzzy coat of the PSD in these two slices. The PSD was semi-automatically segmented and is displayed as a surface rendering both upon a slice of the volume (E) as well as by itself (F). The arrow in (F) points to the hair-like projections that corresponds to the fuzzy coat in the slices. These datasets may be viewed in the Cell Centered Database on-line.
