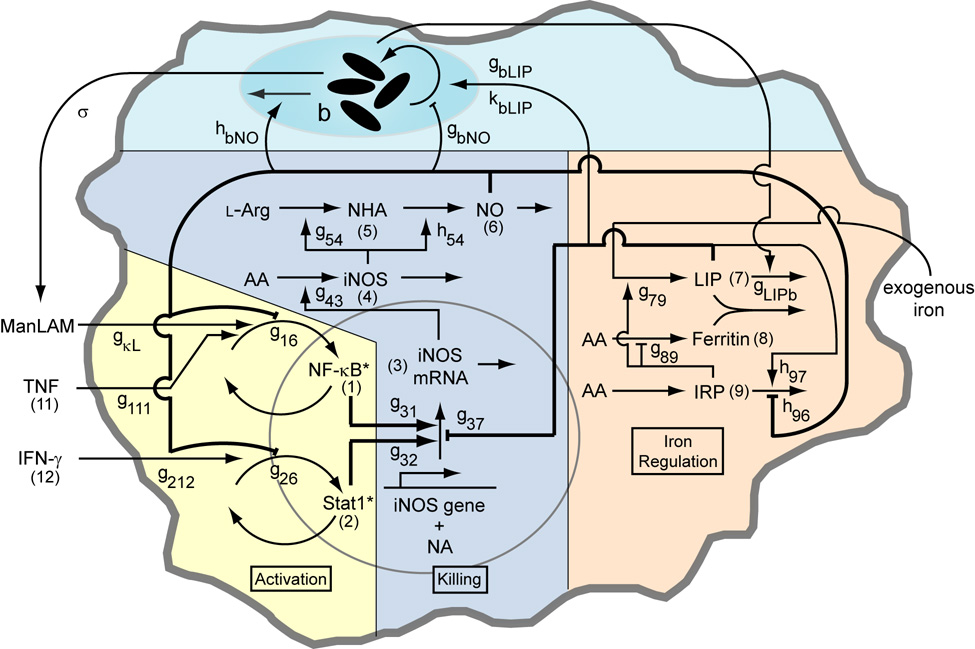
Figure 2.
Schematic of the macrophage network including interactions with an intracellular population of Mycobacterium tuberculosis with parameter names and variable numbers depicted. Numbers in parentheses refer to the variable number of the component (e.g. (1) refers to x1, (11) refers to x11, etc). Parameters gij and hij quantify network interaction types (stimulation or inhibition of a process by a cellular component) and interactions with the bacterial population. See Table A1 for parameter definitions and values. The model is analogous to a cell culture experiment, with these interactions averaged over a large population of macrophages. The biochemical model (Activation, Killing and Iron Regulation) was previously analyzed without a representation of bacteria in (Ray & Kirschner, 2006).

