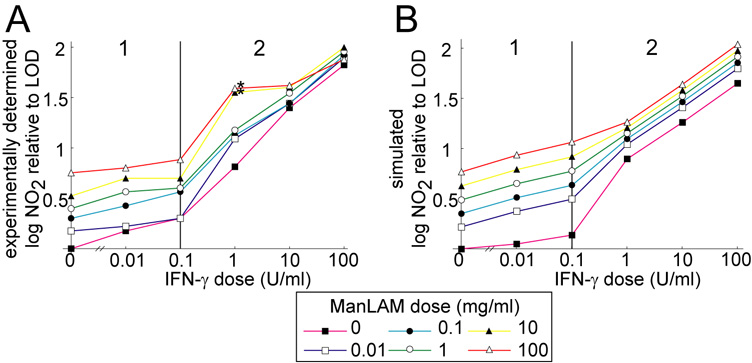
Figure 3.
A. Cumulative nitrite output of J774.16 macrophages at 96 h after treatment with a wide range of ManLAM and IFN-γ doses. Note two distinct response phases based on the dose of IFN-γ marked 1 and 2. B. Simulated cumulative nitrite production at 96 h after treatment reproduces experimental trends. A version of the mathematical model without M. tuberculosis infection simulated the cell culture experiment. LOD: limit of detection for nitrite. The two asterisks denote dose levels excluded from the fitting (see Footnote 1 in the text).

