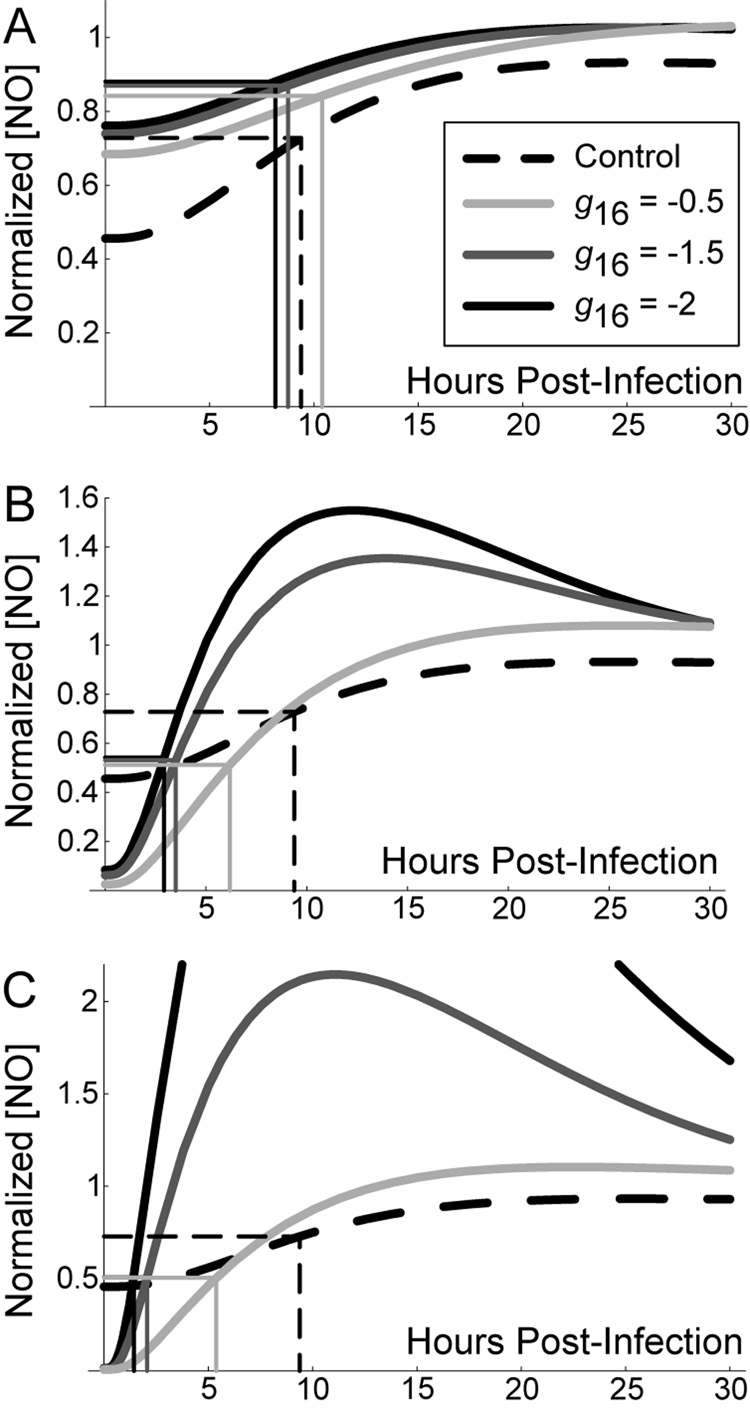
Figure 5.
Stronger negative feedback improves macrophage activation time during infection with M. tuberculosis. Graphs depict the first 30 hours post-infection to show initial kinetics. The level of negative feedback to NF-κB by nitric oxide (represented in the model by parameter g16) was varied using mathematically controlled comparisons. A. TNF and IFN-γ signals preceding infection (Scenario 1). B. Targeted secretion of IFN-γ restricting it to the site of infection (Scenario 2). C. Initial cytokine stimulus concurrent with infection time (Scenario 3). We found the control scenario (without cell-mediated immunity; dashed line in A, B and C) to be constant over variations in the level of feedback; we therefore use it as a reference point between scenarios. Rectangles depict the response time (number of hours for nitric oxide concentration to reach half the level at 100 hours post-infection) for each case. Nitric oxide levels are normalized in each scenario by the level at 100 hours post-infection.

