Table 2.
Sensitivity of M. tuberculosis numbers (100 hours post-infection) to quantitative variations in regulatory interactions
| Partial Rank Correlations with Mtb # | NO regulation of:1 |
||
|---|---|---|---|
| NF-κB | Stat1 | IRP2 | |
| Control |  |
 |
 |
| Scenario 1 | |||
| Scenario 2 | |||
| Scenario 3 | |||
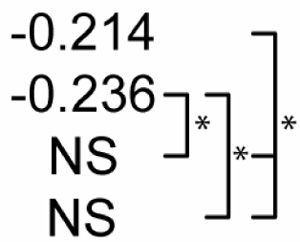
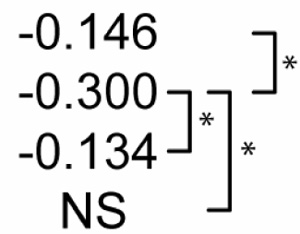
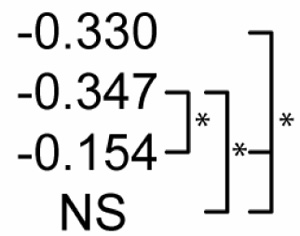
p<0.01. The far right bracket for each parameter denotes significant differences between Control and each numbered scenario. The remaining two brackets denote significant changes between the three numbered scenarios. NS: not significantly different from zero (p > 0.01).
Due to negative regulation by these interactions, correlations with negative signs are interpreted to mean that stronger negative regulation reduces the effectiveness of M. tuberculosis killing.
IRP: Iron response protein. See Figure 2.
