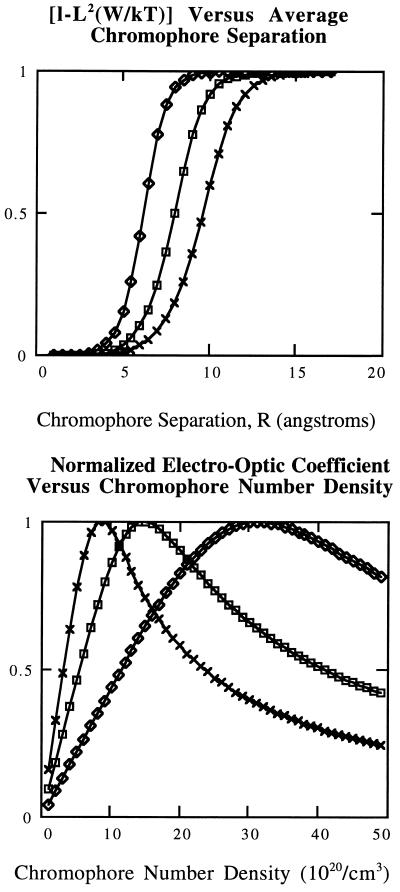
Figure 1.
(Upper) Graphs of [1 − L2(W/kT)] versus R are shown as a function of varying chromophore dipole moment (5 Debye, solid line with diamonds; 7.5 Debye, solid line with squares; and 10 Debye, solid line with x’s). Other variables correspond to those for the DR chromophore (see text). (Lower) Graphs of normalized electro-optic coefficient versus chromophore number density N are shown. Symbols have the same meaning as in Upper.

