
Figure 1. CMR late gadolinium enhancement patterns seen in the study group.
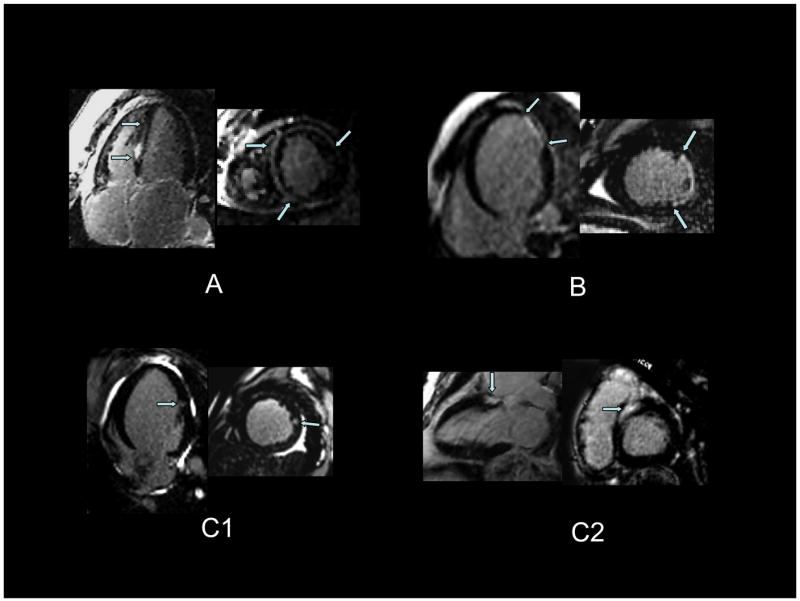
Panel A shows predominantly mid-wall enhancement involving the septal, anterior, and anterolateral walls. Panel B shows apical-lateral near-transmural enhancement (subendocardial to epicardial enhancement). Panel C shows patterns of patchy foci not following an epicardial coronary perfusion territory. In panel C1, there is a focus of mid-lateral wall enhancement. In panel C2, there is basal septal enhancement.