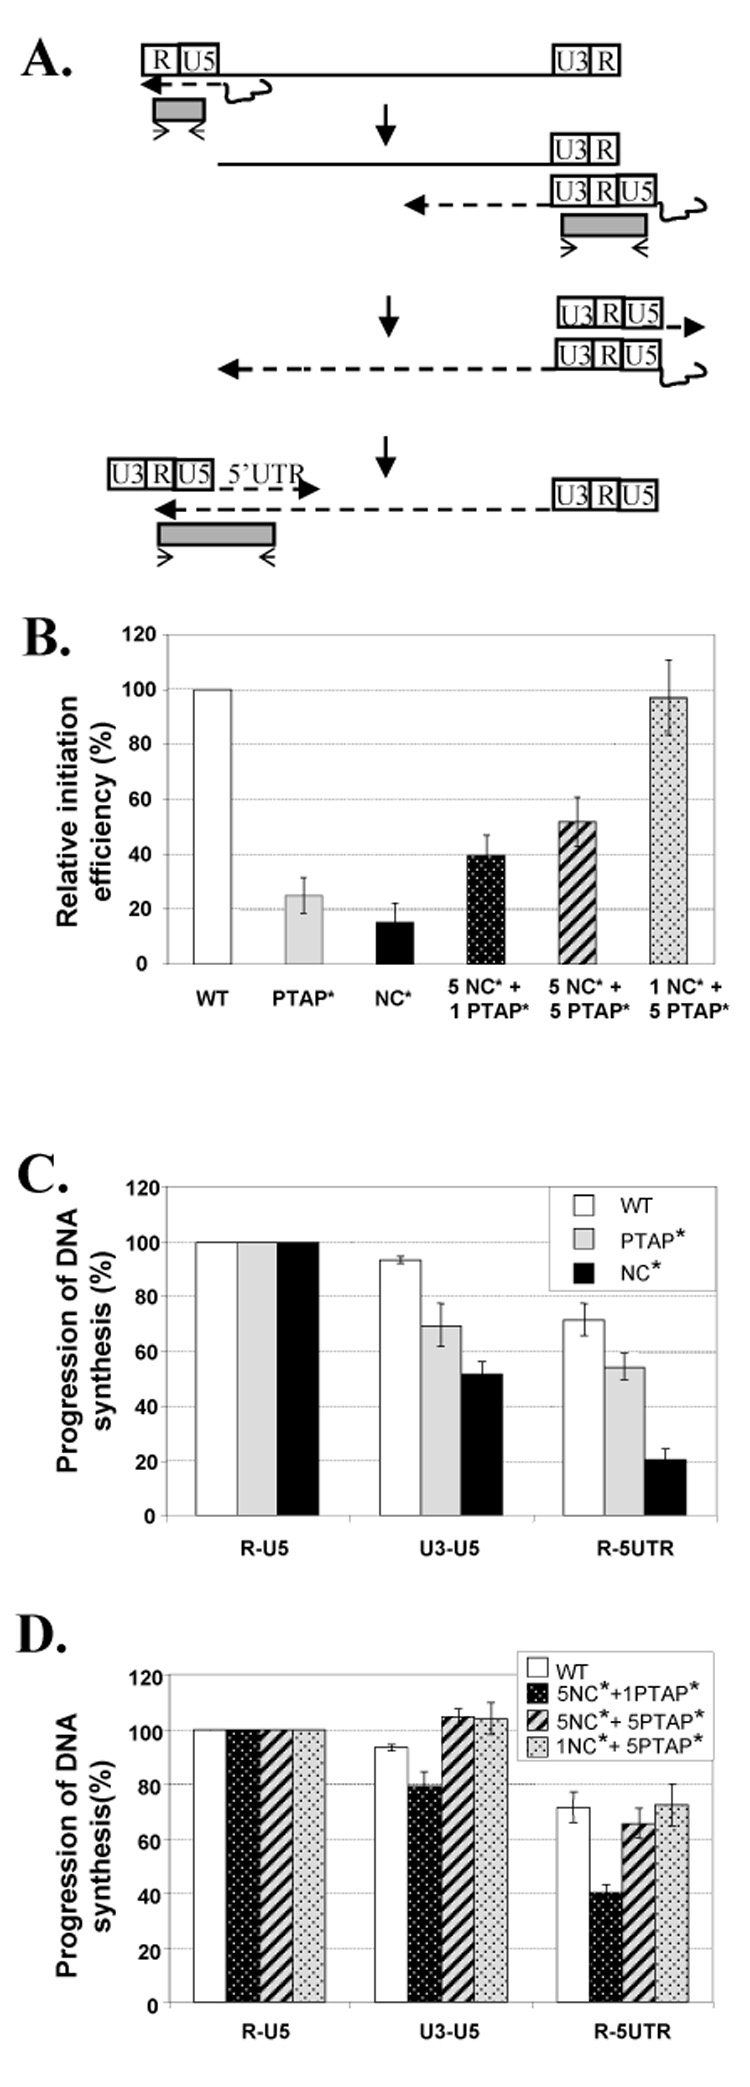
Fig. 4.

Effects of mutant Gag proteins on the initiation and progression of HIV-1 reverse transcription. (A) Schematic representation of the reverse transcription process. A dashed line with an arrow represents the direction of nascent DNA synthesis; the thin solid line with an arrow and the shaded box represents the real-time PCR primer and product, respectively. (B) Relative efficiencies of reverse transcription initiation in mutant viruses. Initiation efficiency was determined by comparing the amount of viral RNAs in the virion sample with the amount of R-U5 DNA generated after infection. The initiation efficiency of wild-type virus was defined as 100%. The initiation efficiency of mutant virus was compared with that of the wild-type virus to generate the relative efficiency. The progression of viral DNA synthesis of wild-type, PTAP*, and NC* viruses (C) and of phenotypically mixed viruses containing Gag proteins from two viruses (D) was analyzed. In the DNA progression studies, the amount of R-U5 product of each sample was defined as 100%, and the amounts of U3-U5 and the R-5’UTR products were expressed as a percentage of the R-U5 product for each sample. Results from more than three independent experiments are summarized; error bars indicate standard errors.
