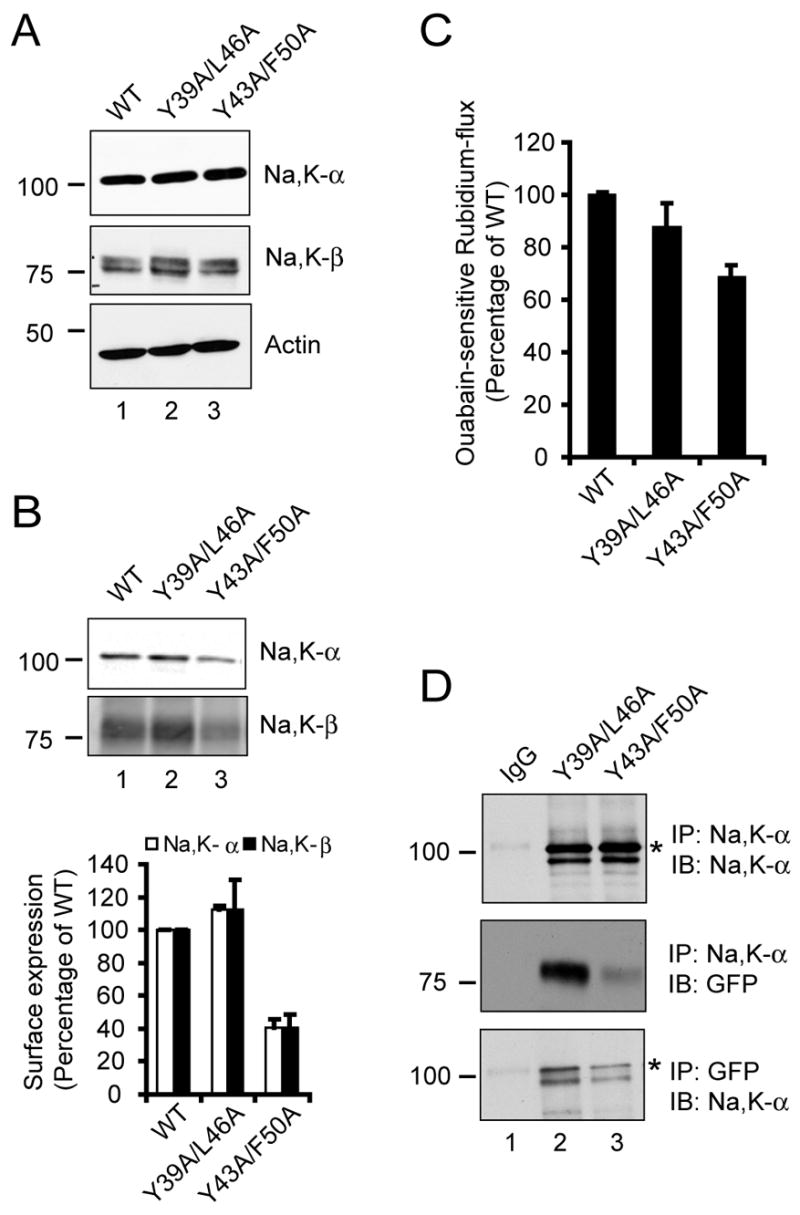
Figure 2.

Characterization of heptad repeat mutants of Na,K-β . (A) Immunoblots showing levels of Na,K-α , Na,K-β and actin (loading control) from 100 μg of total cell lysates of MSV-MDCK cells expressing Na,K-β-GFP (WT), Y39A/L46A or Y43A/F50A mutants. (B) Cell surface biotinylation assay of WT, Y39A/Y46A and Y43A/F50A cells. Lysates from cells labeled with biotin were immunoprecipitated using streptavidin-conjugated agarose beads and immunoblotted with anti-Na,K-α or anti-Na,K-β antibodies. The graph represents the mean from three independent experiments. The error bars denote SE of the mean. (C) Ouabain-sensitive rubidium flux of the above-mentioned cell lines expressed as a percentage of Na,K-β-GFP (WT), which was considered to be 100%. The error bars represent the SE of the mean. (D) MSV-MDCK cells expressing Y39A/L46A or Y43A/F50A mutants of Na,K-β were lysed and immunoprecipitated with either anti-Na,K-α or anti-GFP antibodies and immunoblotted with the indicated antibodies. IgG represents control immunoprecipitation with isotype matched irrelevant IgG from lysates of Y39A/L46A cells blotted similarly with indicated antibodies. The specific Na,K-α band is denoted by an asterisk.
