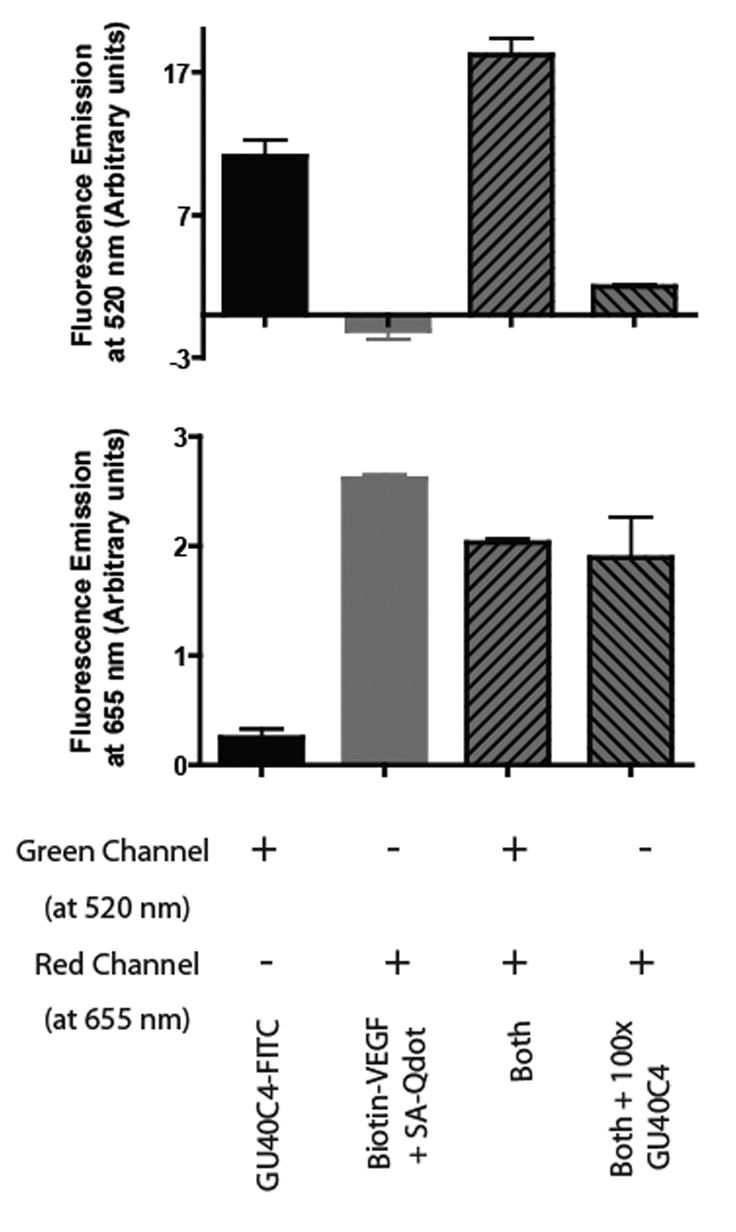
Figure 4.

Retention of GU40C4-FITC and biotin-VEGF by immobilized VEGFR2 ECD. Retention of GU40C4-FITC was monitored at 520 nM (fluorescein emission) while retention of biotin-VEGF was monitored at 655 nm after treatment with red-emitting streptavidin-Qdot655. The top graph shows the retained fluorescence in the 520 nm channel (green-FITC detection) and the bottom graph shows the retained fluorescence at 655 nm (red-Qdot655 detection). The first and second bars in each graph represent the intensity of the retained fluorescence when the immobilized VEGFR2 ECD was treated with GU40C4-FITC alone or biotin-VEGF alone, respectively. The third bar represents the intensity of the retained fluorescence when both GU40C4-FITC and biotin-VEGF were added to the immobilized receptor. Note that the amounts of hormone and peptoid were in large excess over that of the immobilized receptor ECD. The fourth bar represents the same experiment as the third, except that 100-fold excess of unlabeled GU40C4 was also included. In all cases, streptavidin-Qdot655 was added to each well, followed by washing, prior to reading the fluorescence intensity in each channel.
