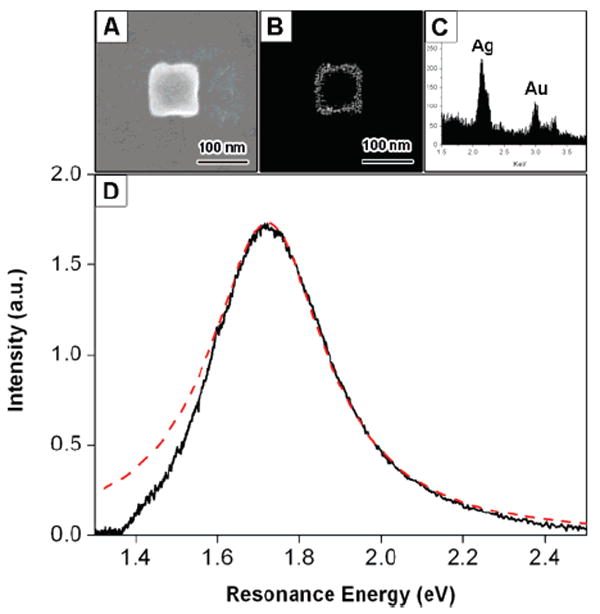
Figure 3.

(A) Secondary electron SEM image of a Au–Ag nanobox. (B) Back scattering SEM image of the nanobox. The wall thickness can be determined from the image. (C) EDAX data of the nanobox, giving a Au/Ag ratio of 1:2. (D) Optical scattering spectrum recorded using dark-field microscopy. The dashed line shows a Lorentzian fit to the spectra.
