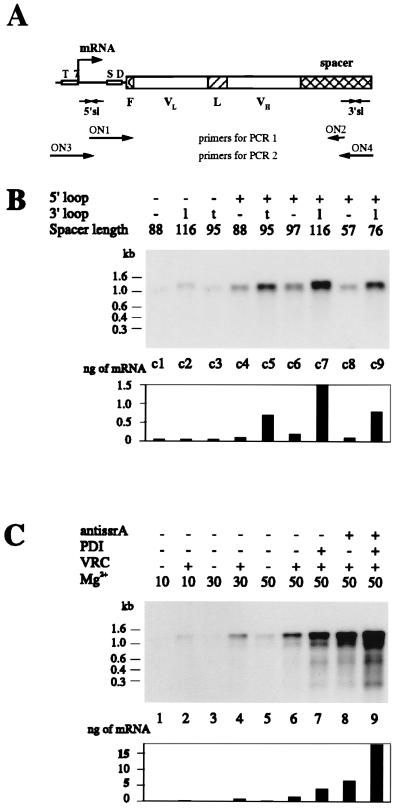
Figure 2.
(A) Schematic drawing of the scFv construct used for ribosome display. T7 denotes the T7 promoter, SD the ribosome-binding site, F the 3-amino-acid-long FLAG (28) with N-terminal methionine, VL and VH the variable domains of the scFv fragment, L the linker, spacer the part of protein construct connecting the folded scFv to the ribosome, and 5′sl and 3′sl the stem–loops on the 5′ and 3′ ends of the mRNA. The arrow indicates the transcriptional start. The strategy for the PCR amplification is shown. (B) The amount of the scFvhag mRNA bound to the polysome complexes is influenced by the secondary structure of its ends and the length of the spacer connecting the folded scFv to the ribosome. Different constructs of scFvhag mRNA were used for one cycle of ribosome display (constructs c1–c9). None of them contained a stop codon. Each species was tested separately. After affinity selection of the ribosome complexes from 100 μl of translation mixtures, mRNAs were isolated and analyzed by Northern hybridization. The presence of the 5′ stem–loop is labeled + or −; that of the 3′ stem–loop is labeled as − when absent, l when derived from lpp term, or t when derived from T3Te. The spacer length indicates the number of amino acids following the scFv and connecting it to the ribosome, including the translated stem–loop. The lengths of RNA in kb are derived from RNA molecular weight marker III (Boehringer Mannheim). The bar graph shows the quantified amounts of mRNA from fluoroimager analysis. (C) Effect of additives on the amount of mRNA bound to the ribosome complexes. The mRNA of the scFvhag construct c7 was used for one cycle of ribosome display. Samples in B lane c7 and C lane 6 are identical. When indicated, 3.5 mM anti-ssrA oligonucleotide ON10 (5′-TTAAGCTGCTAAAGCGTAGTTTTCGTCGTTTGCGACTA-3′), 35 mg/ml protein disulfide isomerase (PDI), or 1 mg/ml VRC was included in the translation mixture. Translations were stopped by addition of Mg(OAc)2 to the final concentration indicated (in mM) and by cooling on ice. After affinity selection of the ribosome complexes from 100 μl of translation mixtures, mRNAs were isolated and analyzed by Northern hybridization. The bar graph shows the quantified amounts of mRNA from fluoroimager analysis.

