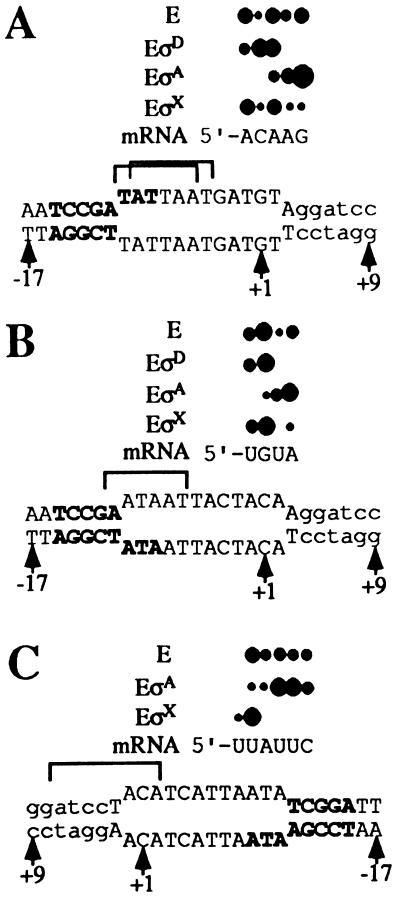
Figure 5.
Summary of the primer extension data from Fig. 4. Bases of the Phag −10 element are shown in bold, and start-site positions are indicated by solid circles, where relative size indicates relative initiation frequency. Bracketed sequences display −10-like sequences of the nontemplate strand that may be recognized by EσA (A and B) or EσX (C). Note that the wtT bubble in C is inverted for comparison purposes.

