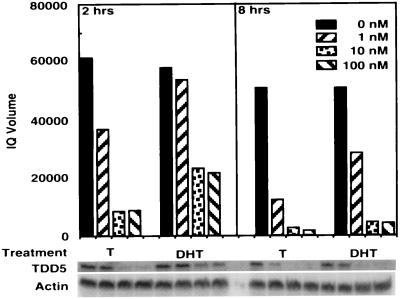
Figure 4.
Effect of T and DHT on the expression level of TDD5-dose-dependent and time course studies. The 312.13 cells were treated with T or DHT at 0 nM (□), 1 nM (□), 10 nM (□), or 100 nM (□) similar to those for differential display for 2 or 8 hr. Total RNA (25 μg per sample per lane) was resolved by electrophoresis in a formaldehyde gel, transferred to a nylon membrane, and hybridized with the 288-bp TDD5 differential display DNA fragment. TDD5- and β-actin-specific bands are shown and were subjected to PhosphorImage imagequant quantification. The quantification results were normalized to the intensity of the β-actin bands.

