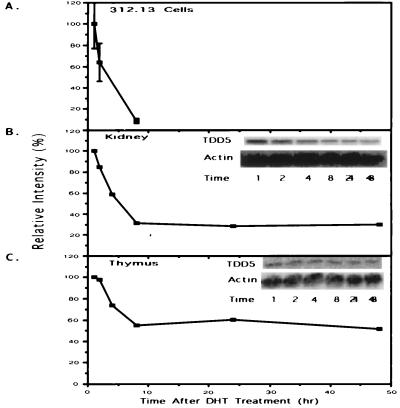
Figure 7.
Expression of TDD5 is consistently repressed by DHT administration both in cells and in animals. (A) Northern blot quantification of TDD5 shown in Fig. 3B is replotted to compare to animal studies (B and C). Results of TDD5 Northern blots from either kidney (B) or thymus (C) obtained from 4-day orchiectomized mice are shown. (B and C Insets) TDD5-specific bands (marked as TDD5) and β-actin bands (marked as Actin for normalization). The relative intensities of TDD5 changes (plotted on the y axis) are calculated against the intensity of normalized 1-hr point obtained from each group. A representative experiment of two experiments on TDD5 mRNA changes during the time course of DHT treatment (1, 2, 4, 8, 24, and 48 hr) is shown.

