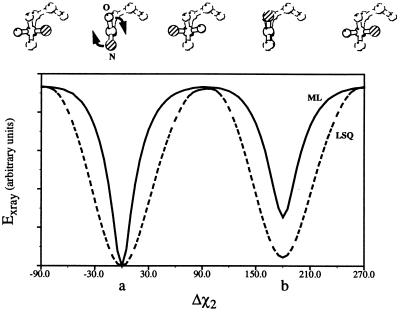
Figure 1.
A comparison of the energy landscapes of the least-squares residual (dashed line) and the maximum likelihood target (solid line). An asparagine residue was placed in a P1 unit cell of size a = 40 Å, b = 40 Å, and c = 40 Å. Diffraction data from 20- to 2-Å resolution were calculated from the structure in its initial conformation. These data were modified by addition of Gaussian error (± 10% of |F|). A single value of σF, 10% of the average amplitude, was used for all reflections. The χ2 dihedral was then rotated in 5° steps, and the value of the x-ray target (Eqs. 1 and 4), compared with the model diffraction data, was calculated at each position. The two minima correspond to the correct solution (a) and a false minimum with the positions of OD1 and ND2 inverted (b). The maximum likelihood target clearly shows sharper minima, broader, flatter maxima, and a less deep false minimum.

