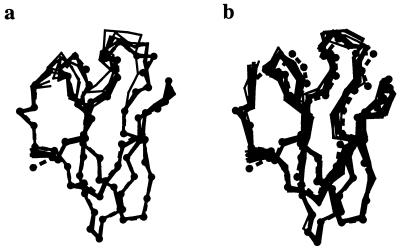
Figure 4.
(a) Result of 10 simulated annealing refinements with the maximum likelihood target (solid lines), compared with the published amylase inhibitor crystal structure (dashed line with Cα atoms shown as solid circles). (b) Same results for 10 refinements with the least-squares residual. The starting model has an rms deviation of 1.9 Å from the published crystal structure. This figure was created with the program molscript (30).

