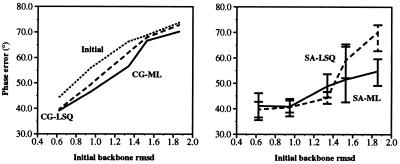
Figure 6.
Final phase error for the least-squares residual target, Eq. 1 (dashed line), and the maximum likelihood target, Eq. 4 (solid line), for refinements of the poly-alanine only scrambled amylase inhibitor structures against diffraction data at dmin = 2.0 Å, with respect to the published crystal structure. (Left) Results for conjugate gradient minimization. (Right) Results for 10 simulated annealing runs with torsion angle dynamics. The simulated annealing graph shows the average of 10 refinements with different initial velocities. Error bars indicate the maximum and minimum phase errors obtained with 10 simulated annealing runs. The best structures are readily identified by the lowest free R-value. Initial phase errors are shown by the upper dotted line.

