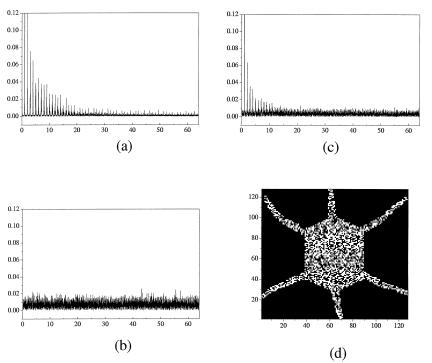
Figure 2.
(a and b) Spatial Fourier power spectra corresponding to the patterns of Fig. 1 a and b, respectively. (c) Spectrum corresponding to two identical offspring permanent patterns (d) obtained when a = 0.6 and that now exhibit noise in their core. Parameter values, a = 0.006, and h = 0.4.

