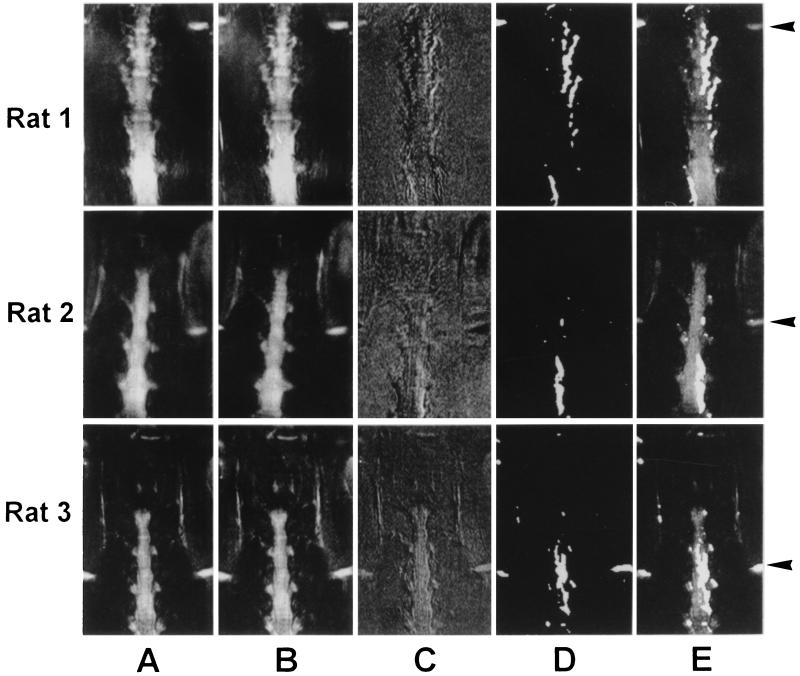
Figure 3.
Visualization of activated spinal cord area after injection of formalin into the left hindpaw. Data sets for three rats are shown. (A) Prestimulation images. (B) Poststimulation images. (C) Difference images (prestimulation minus poststimulation). (D) Filtered difference images (spatial low-pass filtering and intensity thresholding). (E) Overlay of images A and D. For an anatomical reference, the iliac crests were recognized as a hyperintense structure at the left and right margins of the images (arrows).

