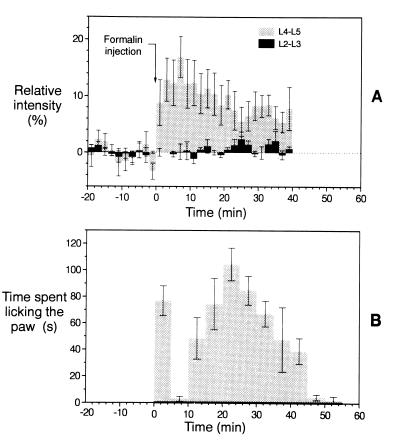
Figure 4.
(A) Relative signal intensity [I(contra) − I(ipsi)]/I(contra) changes (in %) for an ROI in the rat lumbar spine corresponding to L4 and L5 segments (light gray bars). The width of the bar corresponds to the measurement time of 2 min per image. Upon injection of formalin at time 0 (arrow), a sharp intensity change was observed, after which the intensity slowly declined to the baseline values. For comparison, the intensity change in a more rostral ROI corresponding to L2 and L3 segments is shown (black bars). At this level of the spinal cord almost no activation has been observed (n = 6). Values are given as mean ± SEM. (B) Time course of the licking activity in rats (n = 5) into which 50 μl of 5% formalin had been injected into the left hindpaw at time point zero. The time spent with licking the hindpaw was measured in every 5 min interval as indicated by the width of the bars. A group of animals (n = 5) served as a control and was injected with 50 μl of physiological saline instead of formalin. In these experiments licking activity was not observed at all (indicated as the black line in the interval 0–55 min).

