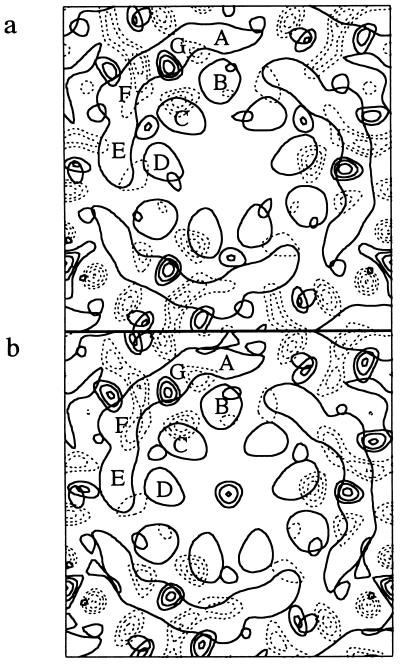
Figure 1.
Difference projection maps of structural changes in D85N bacteriorhodopsin upon raising the pH from 6.0 to 9.2 (a) or 10.4 (b). Bold contour lines indicate density increase, dashed lines density decrease. Although the changes in b are larger than in a, they are represented with equal amplitude. End-on views of transmembrane helices B, C, and D, and the smeared outline of the more tilted helices A, G, F, and E of one bacteriorhodopsin in the trimer are superimposed.

