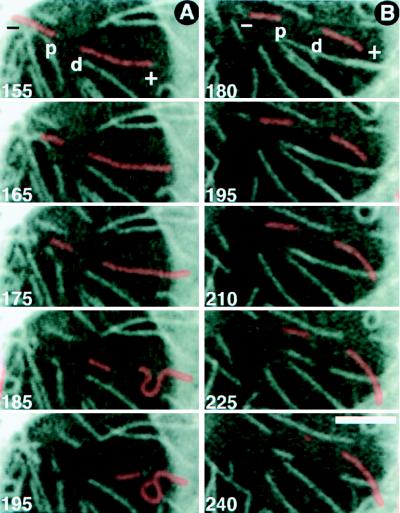
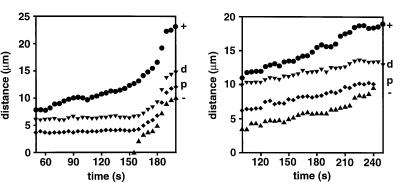
Figure 3.
Marking of MTs by laser bleaching. MTs were marked by a pulse of laser light (514 nm, 480 mW, and 200 ms) producing a 3-μm wide bleached zone. Numbers in the upper left corner of each image correspond to the time (seconds) after bleaching. The minus (−) and plus (+) ends of the MTs, as well as the proximal (p) and distal (d) ends of the bleach zones, are labeled in the first panel of each sequence. Graphs below each sequence show the distance from the centrosome of the MT minus (−, triangles) and plus (+, circles) ends, as well as the proximal (p, diamonds) and distal (d, inverted triangles) ends of the bleached zone vs. time after bleaching. Dotted lines correspond to the times at which the frames were acquired. (A) MT was released (155–160 s) and moves away from the centrosome (≥160 s), with the plus end stopping as it reaches the edge of the nuclear–ventral region (185 s). The minus end continues moving (≥185 s), with the MT buckling as a result. (B) The MT plus end grows while the minus end shortens (beginning at 215 s), producing treadmilling. This is superimposed on motor-based movement of the MT, as indicated by movement of the bleached bar. The MT was released before laser bleaching was performed. The centrosome is out of the field of view, above the upper left corner. (Bar = 5 μm.)


