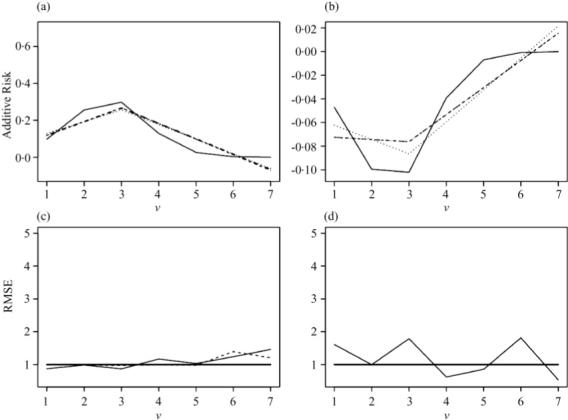
Fig. 2.

Simulation study. Performance of additive risk estimators with n = 1000. The estimators and true values for each V = v for (a) a = 0, (b) a = 1, for the truth, solid line, iptw, dashed line, DR1, dashed-dotted line, and DR2, dotted line. The relative mean-squared error, rmse, relative to the iptw for (c) a = 0 and (d) a = 1 for the DR1, dashed line, and DR2, solid line, with the solid thick black line at RMSE= 1 for reference.
