
FIG. 12.
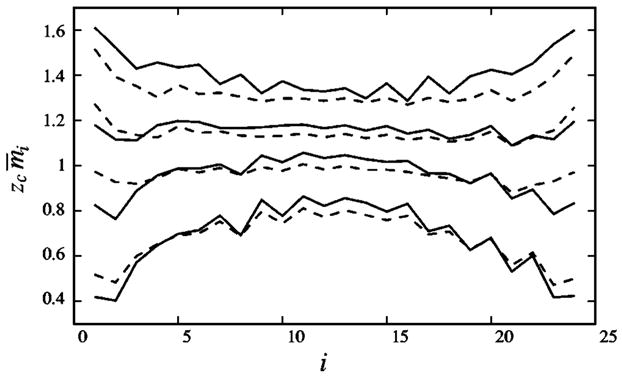
Distribution of the tightly bound counterions along a B-DNA oligomers of length L=24 in [Mg2+] solutions with different salt concentrations c0. mi is the number of the tightly bound ions within ith (i = 1,2,…,L) tightly bound cell and zce is the charge of the counterion. From top to bottom: c0=1M, 0.3M, 0.1M, and 0.01M, respectively. Solid lines are for the preequilibration case and the dashed lines are for the non-preequilibration case. The phosphates (the tightly bound cells) are labeled according to their z coordinates along the DNA axis [see Eq. (1)].