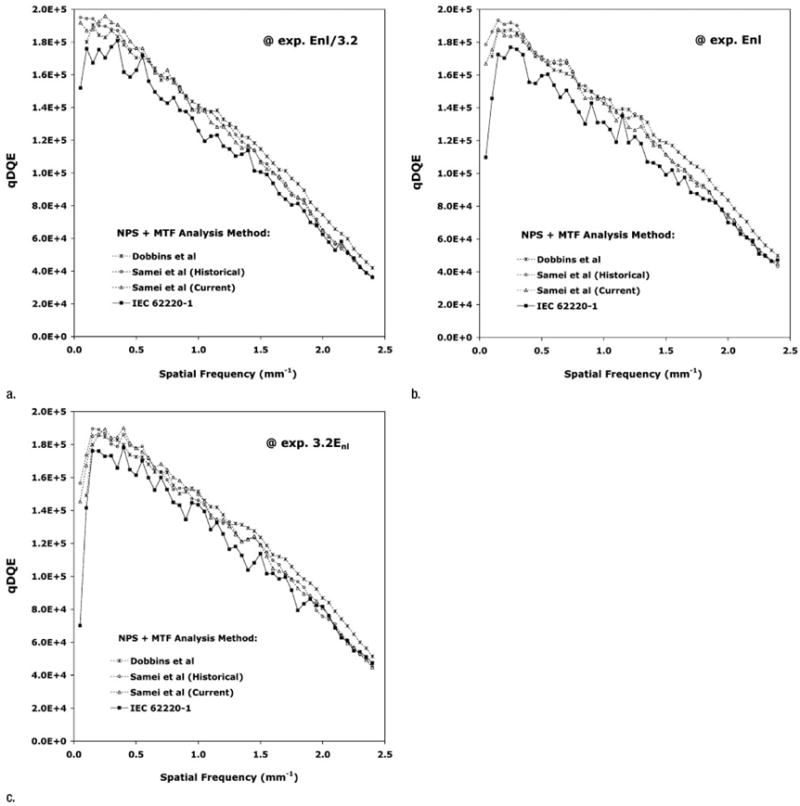
Figure 5.

Graphs illustrate DQE dependence on combined NPS and MTF analysis methods. The q · DQE products corresponding to detector exposures of (a) Enl/3.2, (b) Enl, and (c) 3.2Enl are plotted. Results were obtained by using the IEC beam quality condition with external apertures, a common NPS image data set acquired by using the IEC standard method, and MTF data acquired according to the Dobbins et al (slit), Samei et al (radiolucent edge), and IEC 62220-1 (radiopaque edge) methods. For the NPS estimates, the area of analysis, number of images, and ROIs for each method are those specified in Figure 2. Error bars less than ±2.2%, less than ±2.5%, less than ±2.5%, and less than ±4.3% for the Dobbins et al, Samei and Flynn (historical), Samei et al (current), and IEC 62220-1 methods, respectively.
