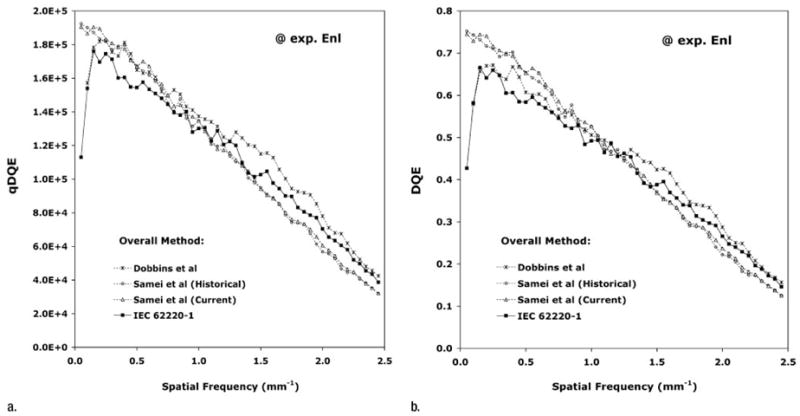
Figure 6.

Graphs illustrate comparison of overall DQE methods, including beam quality and limitation, NPS analysis method, and MTF analysis method (a) without and (b) with q value variations taken into consideration at detector exposure levels corresponding to Enl. For the Dobbins et al overall method, the following parameters were used: 70 kV with 0.5 mm of copper filtration (no beam limitation), the slit MTF method, a 1024 × 1024-pixel analysis area on one image with 64 nonoverlapping 128 × 128-pixel ROIs for NPS analysis, and a q value of 271 500 mm−2 mR−1. For the Samei and Flynn historical method, the following parameters were used: 70 kV with 19 mm of aluminum filtration (no beam limitation), the radiolucent edge MTF method, a 1280 × 1280-pixel analysis area on one image with 100 nonoverlapping 128 × 128-pixel ROIs for NPS analysis, and a q value of 255 855 mm−2 mR−1. For the Samei et al current method, the historical method parameters were used, with the exception that 343 overlapping 128 × 128-pixel ROIs were used for NPS analysis. For the IEC 62220-1 method, the following parameters were used: 74 kV with 21 mm of aluminum filtration, IEC-specified external apertures, the IEC radiopaque edge MTF method, a 640 × 640-pixel analysis area on 10 images with 160 overlapping 256 × 256-pixel ROIs for NPS estimates, and a q value of 264 626 mm−2 mR−1. Error bars less than ±4.0%, less than ±3.8%, less than ±2.2%, and less than ±2.5% for the Dobbins et al, Samei and Flynn (historical), Samei et al (current), and IEC 62220-1 methods, respectively.
