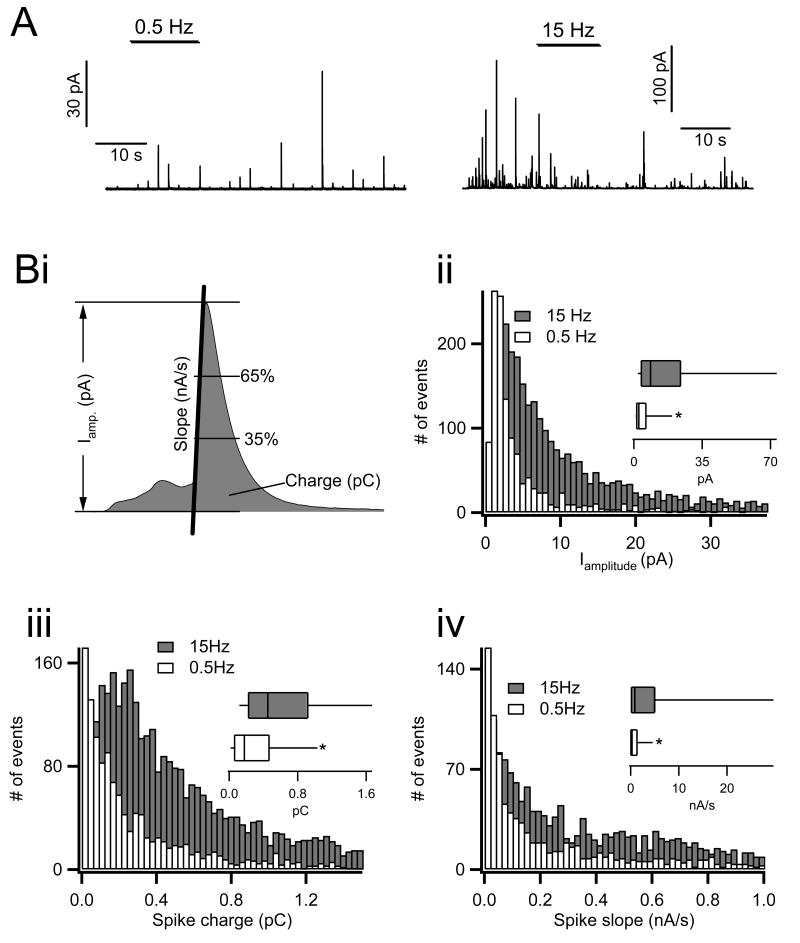
Figure 2.
Amperometric analysis of catecholamine release under 0.5 versus 15 Hz electrical stimulation. Chromaffin cells were held in the perforated patch configuration, held at -80 mV command potential and stimulated with action potential equivalent voltage waveforms. A) Catecholamine release was measured by single cell carbon fiber amperometry. Representative traces from cells stimulated under each condition are provided (note the difference in scale). B) Single amperometric spikes were identified first by an automated detection algorithm and then by eye. Three kinetic parameters were measured for each secretory event. i. These included total spike amplitude (in pA), charge (pC, an index of the total amount of catecholamine released) and initial spike slope (nA/s, the rate of catecholamine release measured between 35% and 65% of total spike height, a parameter proportional to the fusion pore diameter). ii-iv. Histograms were generated from the raw data to show population distributions of each parameter and are presented. Insets in each panel show box-and-whisker plots for each data set. Parameters for the box-and-whisker plots were as follows; smallest non-outlier observation, first quartile, median, third quartile and largest non-outlier observation. Statistical significance for each parameter was determined by a Mann-Whitney non-parametric median analysis and asterisks in each box-and-whisker plot indicate statistical significance (P < 0.001, n=14 cells for each condition).

