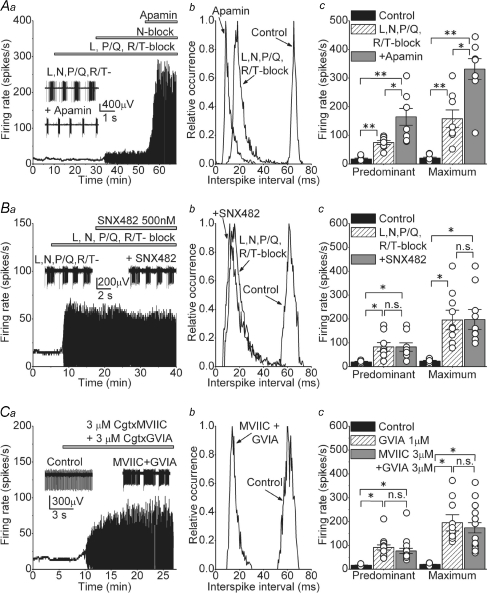
Figure 5. Additional calcium influx pathways activate SK channels and contribute to the firing rate of DCN neurons.
Aa, the rate of spontaneous activity of a DCN neuron in control solution and after sequential addition of a mixture of L-, P/Q- and R/T-type calcium channel blockers (2 μm nimodipine, 200 nm ω-agatoxin IVA and 5 μm mibefradil), then 1 μm Cgtx GVIA to block N-type calcium channels, and 100 nm apamin to block SK channels. The inset shows raw traces before and after application of apamin. Ab, interspike interval histogram of the cell shown in Aa. Ac, predominant and maximum spontaneous firing rates of individual cells together with the averages in control, after L-, N-, P/Q- and R/T-type calcium channels were blocked by 2 μm nimodipine, 1 μm Cgtx GVIA, 200 nm ω-agatoxin IVA and 5 μm mibefradil (L-, N-, P/Q- and R/T-block), and after the successive addition of 100 nm apamin. *P < 0.01 in predominant FR and P < 0.05 in maximum FR. **P < 0.001, n = 8 cells. Ba, the rate of spontaneous activity of a DCN neuron in control solution and after sequential addition of L-, N-, P/Q- and R/T-type calcium channels blockers, and 500 nm SNX-482 to specifically block R-type calcium channels. The inset shows example of raw traces obtained before and after addition of SNX-482. Bb, histogram of the interspike interval distribution of the cell in Ba. Bc, individual and average firing rates obtained in 9 cells in control, after blocking L-, N-, P/Q- and R/T-type calcium channels and after blocking all R-type channels with SNX-482 *P < 0.001. Ca, continuous recording of a cell in control conditions and after adding a combination of Cgtx MVIIC and Cgtx GVIA both at 3 μm. The inset shows example of raw data showing the bursts observed after the toxins. Cb, distribution of interspike intervals before and after concurrent addition of 3 μm Cgtx MVIIC and 3 μm Cgtx GVIA. Cc, average and individual data from the cells exposed to the combination of toxins before and after. The FR obtained in the presence of 1 μm Cgtx GVIA is also plotted to allow direct comparison. *P < 0.001; n.s., not significant, n = 17.

