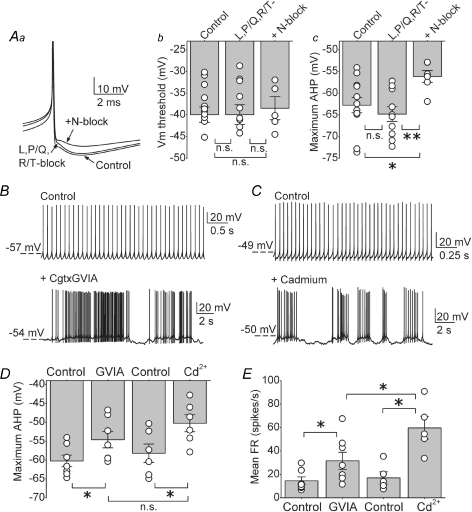
Figure 7. N-type, but not L-, P/Q- or R/T-type, calcium channels significantly contribute to the action potential afterhyperpolarization in DCN neurons.
Aa, truncated traces of action potentials obtained from whole-cell current clamp recording from a DCN neuron in I = 0 mode before (control), and after sequential additions of a mixture of L-, P/Q- and R/T-type calcium channel blockers (2 μm nimodipine, 200 nm ω-agatoxin IVA and 5 μm mibefradil) and 1 μm Cgtx GVIA to block N-type calcium channels. Ab, the action potential threshold of individual cells together with the averages in control solution, in the presence of a mixture of L-, P/Q- and R/T-type calcium channel blockers (2 μm nimodipine, 200 nm ω-agatoxin IVA and 5 μm mibefradil), and subsequent block of N-type calcium channels with 1 μm Cgtx GVIA. Ac, the average maximum afterhyperpolarization (AHP) and individual data for the same cells and conditions shown in B. *P < 0.03, **P < 0.005. n = 12 cells for control and L-, P/Q- and R/T-type calcium channels, n = 6 after addition of N-type blocker. B, raw traces of whole-cell current clamp recordings in control conditions and after adding 1 μm Cgtx GVIA. C, similar to B; current clamp recordings before and after application of 100 μm cadmium. D, maximum AHP of the action potential waveform measured in the cells recorded soon after establishing whole-cell configuration (B and C). Average and individual data are plotted per condition. *P < 0.01. n = 7 cells in Cgtx GVIA and n = 6 cells in cadmium. E, mean firing rate of the same cells in D. The graph shows the average and the individual values obtained in each condition. *P < 0.05. n.s., not significant.

