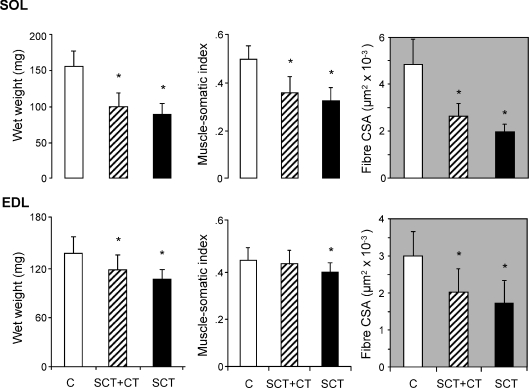
Figure 1. Morphological characteristics of fast- and slow-twitch skeletal muscles of the rat hind limb following long-term paralysis induced by a complete transversal section of the spinal cord: effect of OEG transplantation.
The figure represents the absolute and relative (body weight and muscle-somatic index) wet weights and mean fibre cross-sectional area (CSA) of the slow-twitch SOL and fast-twitch EDL muscles of sham-operated controls (C, n = 8), spinal cord-transected (SCT, n = 11) and SCT, OEG-transplanted (SCT + CT, n = 9) rats. Data are means ± s.d. of the number of animals per group indicated above. Since both hind limbs were considered independently, the number of samples was twice the number of animals per group. *P < 0.05, SCT or SCT + CT versus sham-operated controls.

