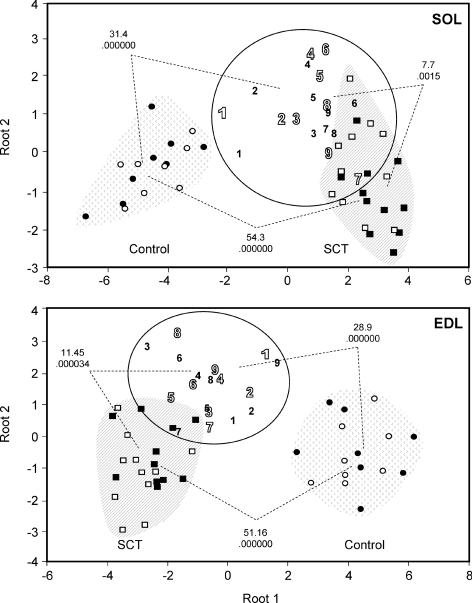
Figure 5. Phenotypic classification of individual hind limb muscles of OEG-transplanted rats in relation to non-transplanted and sham-operated controls by means of multivariate discriminant analysis.
Individual SOL and EDL muscles of left and right hind limbs of all experimental rats were classified into different groups as a function of a cohort of phenotypic characteristics by means of discriminant analysis. The discriminant model for the SOL included the following variables: wet weight, muscle-somatic index, percentage of fibre types I, I + IIA, IIA, IIAD/X and IIX/D, SDH, GPDH, CSA, fraction of slow rMLC isoform from total rMLC (rMLCs/rMLCt), fraction of slow eMLC isoform from total eMLC (eMLCs/eMLCt), variant 2s/rMLCt, variant 2s/rMLCs, variant 2f/rMLCt and variant 2f/rMLCf. The same parameters were considered also for the EDL muscle, except that the percentage of fibre types IIX/DB and IIB was taken instead of types I and IIA. Circles represent the relative distribution of sham-operated rat control muscles when all the phenotypic markers mentioned above are considered together; squares represent SCT rats; 1–9 refer to individual SCT + CT animals, numbered from best (1) to worst (9) recovered according to the scores of behavioural tests (Ramon-Cueto et al. 2000). Open and filled symbols represent left and right hind limb muscles, respectively. For both muscle types, OEG-transplanted animals configure an independent phenotypic group, different from both control and SCT animals. The squares of the Mahalanobis distances between pairs of groups indicative of the relative phenotypic divergences are indicated together with the P values for the statistical significance of the comparisons between pairs of groups.

