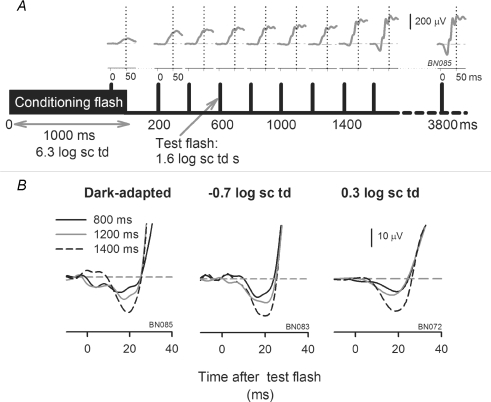
Figure 5. Protocol to isolate the cone-driven portion of the ERG.
A, schematic diagram showing the protocol for determining the interstimulus interval for isolating cone-driven responses using a paired-flash protocol. A high energy conditioning flash (6.3 log sc td, 1000 ms duration), for any background (dark-adapted condition in this example, subject BN085) was used to suppress rods fully and cones partially. Test flashes (1.6 log sc td s) presented at incrementing intervals after the conditioning flash were used to follow recovery of the ERG. ERGs recorded in response to test flashes are shown above the time markers. The illustrated response was the difference of the ERG response to conditioning flash + test flash and the conditioning flash. The vertical dotted lines at 50 ms after the test flash show the cone ERG b-wave time to peak. The cone b-waves had almost fully recovered (93%) by 800 ms after offset of the conditioning flash. The ERG grew in size for later times as the rods recovered. B, the practically full recovery of the cone-driven a-wave at 800 ms, and the beginning of the recovery of the mixed rod + cone-driven a-waves at 1200 and 1400 ms after offset of the conditioning flash are illustrated on an expanded time scale.

