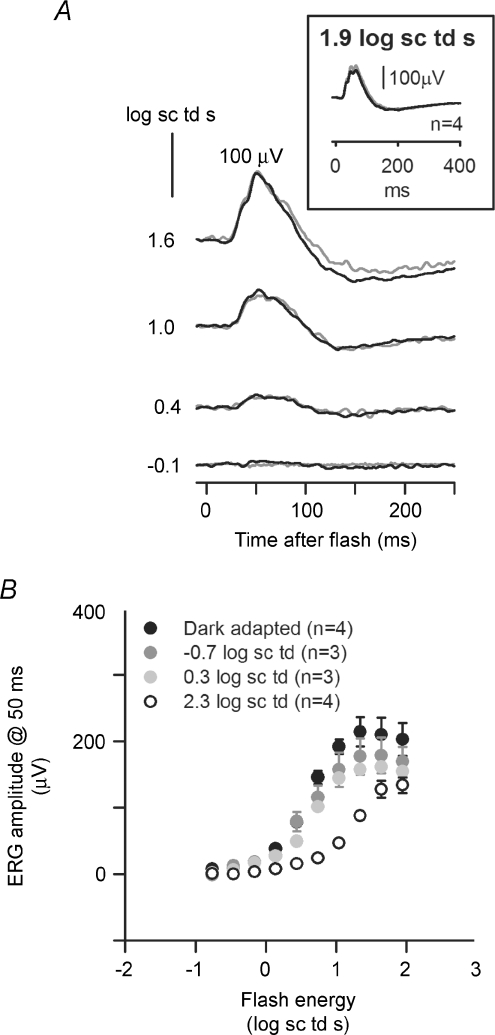
Figure 7. Effect of cone isolation under rod-suppressed (photopic) conditions (2.3 log sc td).
A, comparison of ERGs recorded in the presence of the steady photopic background (2.3 log sc td) using either the paired flash protocol to isolate cone signals (grey trace) or normal single flashes (black trace) for a single subject. The inset shows that the average ERG waveforms (n = 4) recorded for the same subjects using both protocols were similar. B, light adaptation of the cone-isolated energy response functions. Amplitudes (group mean ± s.e.m.) measured at 50 ms near the peak of the cone-driven b-wave as a function of stimulus energy for four different background conditions.

